Scans#
A scan runs one setup at every point of a grid of its parameters: the capillary at
several pressures, say, or at every pair of a pressure and an energy. It is solprop’s
own scan, written to the setup’s [scan] table and run with
run_scan(), so a scan set up in the window runs the same
from solprop run or a script.
Setting one up#
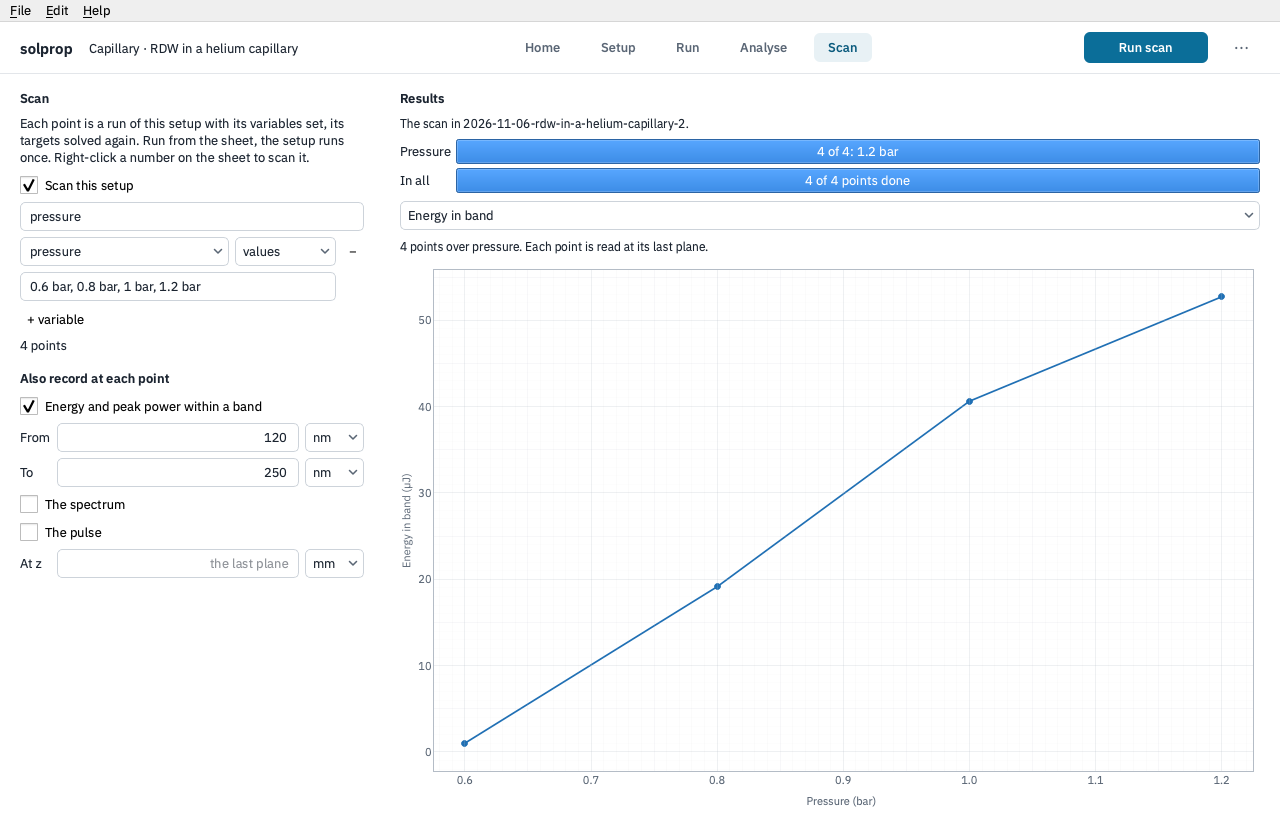
Right-click a number on the setup sheet and choose Scan this…: the Scan stage opens with that parameter as the scan’s first variable, from its value. Or go to the Scan stage and tick Scan this setup.
The name names the scan’s file and derives each point’s random seed.
Each variable is a parameter and its values, given as a list (
0.6 bar, 0.8 bar, 1 bar) or as a range of evenly or logarithmically spaced points. + variable adds another; the scan runs every combination, and the stage says how many points that is.A pressure given as a profile along the guide offers each of its points as a variable of its own, so a scan can move the pressure at the entrance and leave the exit’s.
At each point solprop records the run’s statistics. Also record at each point adds what the statistics do not hold: the energy and peak power within a band of wavelengths, and on a scan of one variable, the spectrum or the pulse. Each is read at the run’s last plane, or at the distance At z gives. A point’s own fields are not kept, which keeps a scan small.
Every point is a run of the setup with its variables set, and with its targets solved again: a scan of the pressure under a soliton-order target moves the energy at each point to keep the order.
Running it#
Run scan runs every point. A bar for each variable, outermost first, shows the value it is at, under one for the whole scan. Stop ends it within a step of the points running; the points finished stay in its file. Run on the Setup stage runs the setup once, without the scan.
Its results#
The scan’s file goes in a run folder like any run, and opening it from Home brings it back to this stage. Choose what to show from the list above the plot:
A number, such as the energy in the band, is drawn against the first variable, with a line for each value of the second (up to eight). A point that failed is marked × along the foot of the plot.
A spectrum or a pulse recorded at each point is drawn as a map against the scan’s variable.
Right-click a point and choose Open this point as a setup to open the setup at that point’s values as a new sheet, to run it with its fields kept or to change it further.